- Manually
- Open the Pdf file with image using Adobe Acrobat Reader.
- Go to the page with image you want to extract.
- If the 'Select Tool' with an arrow image is not on your toolbar, right-click toolbar, click 'Select & Zoom', then check 'Select Tool'.
- Click 'Select Tool', now the mouse pointer is an arrow.
- Right-click the image, then click 'Copy Image'. (or press 'Ctrl-c')
- Click 'Start', 'All Program', 'Accessories', then run 'Paint'. (you can use your other favorit image edit software instead)
- Press 'Ctrl-v'.
- Finally, save the file as a jpg or other graphic format file.
- Online
- I like ExtractPdf.com, which can extract Images, Text or EVEN Fonts from a PDF File.
- Sofeware
- try -pdfimages- of Xpdf, for example, "pdfimages -j name.pdf nameimg"
- or try the nagware Some PDF Images Extract of Some PDF
Friday, December 07, 2012
How to extract an image from a PDF file
How to extract an image from a Pdf file?
Tuesday, November 27, 2012
Survival analysis using Stata
Survival analysis using Stata
- Survival Analysis with Stata - Stephen P. Jenkins
- What is the relationship between baseline hazard and baseline hazard contribution?
- Cox's Proportional Hazards Model and Cox Regression - Princeton University
- How to get the hazard and survival functions for a specific time point?
- Introduction to Duration Models - Matt Golder
Monday, November 19, 2012
Stata Programming
Stata programming
- Stata Blog: Programming an estimation command in Stata: A map to posted entries
- Manage the ado programs
- Stata Syntax-highlighting for Notepad++ or download from the Notepad++ website
- Syntax Highlight Packages (Dynamic documents in Stata: MarkDoc, Ketchup, and Weaver): Synlight, Weaver, MarkDoc
- Determine build-in command or ado-file: which command
- Check codes: viewsource command or type "directory\xxx.ado"
- list of the packages: ado dir
- Install: ssc install package
- check update: adooupdate
- update: adoupdate, update
- uninstall: ado uninstall package|[#]
- re-run profile.do: do profile.do
- How to edit an ado file, '- ADOEDIT -': module to edit ado file in Stata's do-file editor
- Programming Stata of Stata Tutorial - Princeton University.
- The University of Wisconsin provides nice websites for Stata for Researchers and Programming in Stata. The new Stata Programming Essentials is better for new programmers and the new Stata Programming Tools is better for more advanced persons.
- Macro: global and local macros: macro dir/macro drop
- Example Macro with `' and/or "":
- for both local and global macro, braces { and } can be used to form nested constructions.
- global pth "c:\abc\"
- di "${pth}def\" // ==> c:\abc\def\
- local x 2+2
- di "x" // ==> x
- di `x' // ==> 2+2 ==> 4
- di "`x'" // ==> 2+2
- local x=2+2 // ==> local x 4
- di `x' // ==> 4
- di "`x'" // ==> 4
- di "`=2+2'" // ==> 4
- di "`2+2'" // ==> N/A
- local x 2
- di "`=`x'-2'" // ==> 0
- local pth "c:\project"
- di "`pth'\data\" //==> "c:\project\data\"
- global pt "c:\project"
- di "$pt\data\" //==> "c:\project\data\"
- di "${pt}data\" //==> "c:\projectdata\"
- local a 2+3
- local b 7
- display `a'+`b' //==> 10
- display "`a'+`b'" //==> 2+3+7
- display "`a'"+"`b'" //==> 2+3+"7" invalid name
- display "`a'""+""`b'" //==> 2+3+7
- regress mpg weight
- local rsqf e(r2)
- local rsqv = e(r2)
- di "R-squared_1f=`rsqf'" //==> R-squared_1f=e(r2)
- di "R-squared_1v=`rsqv'" //==> R-squared_1v=.6515312529087511
- di "R-squared_2f=" `rsqf' //==> R-squared_2f=.65153125
- di "R-squared_2v=" `rsqv' //==> R-squared_2v=.65153125
- di "R-squared_3f=" "``rsqf''" //==> R-squared_3f=.6515312529087511
- di "R-squared_3v=" "``rsqv''" //==> N/A
- Stata Blog: Programming an estimation command in Stata
- Example 1: Storing and extracting the result of an extended macro function
- local count : word count a b c
- display "count contains `count'" ==> count contains 3
- Example 2: Using gettoken to store first token only
- local mylist y x1 x2
- display "mylist contains `mylist'" ==> mylist contains y x1 x2
- gettoken first : mylist
- display "first contains `first'" ==> first contains y
- Example 3: Using gettoken to store first and remaining tokens
- gettoken first left: mylist
- display "first contains `first'" ==> first contains y
- display "left contains `left'" ==> left contains x1 x2
- Example 4: Local macro update
- local p = 1
- local p = `p' + 3
- display "p is now `p'" ==> p is now 4
- Example 5: Local macro update
- local p = 1
- local ++p
- display "p is now `p'" ==> p is now 2
Friday, November 16, 2012
The rule of thumb: AIC preference/signficance levels
The rule of thumb: AIC and BIC preference/signficance levels
The Akaike information criterion (AIC) is a measure of the relative goodness of fit of a statistical model, which was developed by Hirotsugu Akaike in 1974. It was not much appreciated until 21 century. Now it’s one of the most used fit statistic output for statistical modeling. The preferred model is the one with the minimum AIC value; however, there are no statistic test for model choice based on this criterion. I found a table in Joseph M Hilbe’s book (Negative Binomial Regression, 2nd Ed, 2011) which may help us to choose a better model. Below is a table I modified based on his confusing table:
AIC = -2(log-likelihood) + 2(number of predictors including the intercept)
========================================
AIC of (Model A – Model B) , if AIC(A) > AIC(B)
----------------------------------------------------------------
< 2.5 No difference in models
2.5 – 5.9 Prefer B if sample size n > 256
6.0 – 9.9 Prefer B if sample size n > 64
≥ 10.0 Prefer B
========================================
Another criterion measure is Bayesian information criterion (BIC). Raftery AE (1995) gave the scale for relative preference of two models (I modified the table in Hilbe's book):
BIC = -2(log-likelihood) + (number of predictors including the intercept)*(ln(sample size))
========================================
BIC of (Model A – Model B) , if BIC(A) > BIC(B)
----------------------------------------------------------------
< 2.0 Weak
2.0 – 5.9 Positive and prefer B
6.0 – 9.9 Strong and prefer B
≥ 10.0 Very strong and prefer B
========================================
Sunday, November 11, 2012
Gardening and Cooking
Gardening
- How to build a raised vegetable garden. - This Old House
- How to Garden tips or Gardening Help - BackyardGardener.com
- Pest Control: spray Bifen Bifenthrin (Wiki), which is one major chemial of Ortho Home Defense Max (how to use it), using Gilmour 362 Professional No Pre-Mix Sprayer (Youtube, set 2 for ants control).
- Today's Homeowner with Danny Lipford
- YouTube. Pavestone Paver Installation
- Allrecipes.com - recipes, menus, meal ideas, food, and cooking tips. It has a Chinese version website called 十全菜谱.
- MyRecipes.com Find the Best Recipes, Dinner Ideas, and Menus
- Food Network - Easy Recipes, Healthy Eating Ideas and Chef Recipe Videos
- Rasa Malaysia - Recipes site for home cooks who love Chinese recipes, Japanese, Thai, Malaysian & Asian recipes. Easy recipes with tips and gorgeous food photography.
- Epicurious
- 心食谱 - 菜谱大全
- 美食杰 - 做你最喜爱的美食,食谱,菜谱网
- 美食天下 - 中国最具人气美食网
- 菜谱网
- 豆果网 - 中文美食菜谱分享网站
- 品味舌尖上的中国:《舌尖上的中国》播出后迅速风靡网络,才下舌尖,又上心头的不仅仅是美味更有温情,现在就跟着百度经验一起走进美食背后,揭秘那缱绻在味蕾之间的东方况味,亲手打造一场饕餮盛宴,让您品尽南北美食,体会百味人生!
- Wheat Gluten (Seitan)
- How To Make Seitan (Wheat Gluten) from Flour - Eating Rules.
- Homemade Gluten - Youtube
- Seitan - The Vegetarian Wheat Meat - Vegetarian Resource Group
- 自制面筋 - 心食谱
- Tofu
- Coagulant: Nigari coagulant (Magnesium Chloride 氯化镁 for 卤水豆腐) or glucono-delta-lactone (葡萄糖内脂 for 内酯豆腐). As alternatives: 3 cups of dry soy beans and 2 TBSP of Epsom Salt, or you may use 75ml of lemon juice.
- 终于吃上自己做的豆腐了——如何做卤水豆腐
- How to Make Tofu - YouTube
- How to Make Tofu—no fancy equipment required - La Fuji Mama
- How to Make Tofu at Home - Soy Milk Makers
- How to Make Fresh Silken Tofu from Soy Milk
- How to Make Your Tofu And Eat It, Too - NPR KitchenWindow
- Yelp.com is a great website to find great local restaurants.
- Kiku Japanese Steak & Sushi House, Atlanta, Georgia (Lenox location)
- Ana White - Woodworker & DIYer
- Wood Worker's Workshop: Free Woodworking Plans
- Family Handyman
- This Old House
- ToolGuyd – The Latest Tool Reviews, New Tool Previews, Best Tool Picks & Deals Blog
- YouTube: Replace your iPhone 5 battery in 2 Minutes
- How to DIY a passport photo
- How to turn off/on the ANC (active noise cancellation) system of 2013 Honda Pilot
- How to make your own Rivnut tool and install the Pilot running board by yourself:
- How to Install and Set a 3TB Hard Drive for Desktop PC (YouTube)
- How to recover a lost partition of a hard drive
- How to fix "The File Or Directory Is Corrupted Or Unreadable" and Hard Drive Wont Open (YouTube)
- Northview High School 2017 Robotics Banquet
Thursday, November 01, 2012
Resource and Tips of Stata
Resource and Tips of Stata
- Stata Documentation
- UCLA Statistical Computing: Stata
- SDAS: Stata Tech Tips
- University of Wisconsin: Statistical Computing
- Blog: Stata tips of Stata Journal
- Stata: Q & A Survey data analysis
- Stata News: in the spotlight
- Commands related to find/search the variables: -ds-, -lookfor-
- Programming
- Blog: Stata programming
- Blog: Useful and Interesting User-written ado Programs/packages
- Blog: Recycle/use returned results in Stata
- Blog: Stata undocumented commands and options
- Blog: Stata: Output and reuse the estimates of a histogram
- Blog: Stata: Output the results into text files
- Blog: Stata: Output the results into Excel tables
- UCLA: Perform the likelihood ratio, Wald, and Lagrange multiplier (score) test in Stata
- Blog: Get predicted incidence rate using -poisson- of Stata
- Blog: Matrix in Stata; Using Mata to work more effectively with Stata: A tutorial; A Beginner's Guide to Matrix algebra and Matrix Linear Regression Using Stata (Mata)
- Blog: Trend analysis in Stata
- Blog: Get rates by multiple variables for complex sampling designed data
- Blog: Build complicated expressions the easy way
- Blog: Function vs. extended function & -generate- vs. -egen-
- Blog: Chow test to determine whether data can be pooled together
- Blog: How to get predicted incidence rate using -poisson- of Stata
- Blog: Test significance of interactions of categorical variables
- Blog: How to calculate the confidence interval of incidence rate under the Poisson distribution
- Blog: Generate composite categorical variables and indicate/dummy variables, convert a continuous variable into a categorical variable
- Blog: Do 'lincom' after a three-way 'margins'
- Blog: Can 'margins' be used after 'mi estimate'
- Blog: Why I get error message, when using 'margins' for complex sampling data
- Blog: Get orthogonal polynomial coefficient/vector/codes.
- Blog: How to compare regression coefficients between models using -suest-.
- Blog: Do Bootstrap/Jackknife in Stata
- UIUC: An example of Delta-Method and Bootstrap Techniques - Econometrics at the University of Illinois
- Blog: Get out-of-sample file predictions
- Blog: Stata display system date
- Blog: Survival analysis using Stata
- Delta method: Margins using the delta method (Stata), Computation of Standard Errors, Wikipedia, Gary White, R (UCLA, Stata like packages: margins, modmarg)
Wednesday, October 31, 2012
How to get predicted incidence rate using -poisson- of Stata
How to get predicted incidence rate using -poisson- of Stata
The Stata -poisson- can be used to model count variables/incidence rate. However, the default predicted margin is a predicted number of events. We need use the -predict(ir)- option to get the predicted incidence rate.
-n-, the default, calculates the predicted number of events. -ir- calculates the incidence rate exp(Xjbeta), which is the predicted number of events when exposure is 1. Specifying -ir- is equivalent to specifying -n- when neither -offset()- nor -exposure()- was specified when the model was fit. For example:
webuse nhanes2, clear
svy: poisson hlthstat age i.region
margins region, predict(ir) at(age=50) vce(svy)
Factor variable operators
- i. unary operator to specifiy indicators
- c. unary operator to treat as continuous
- o. unary operator to omit a variable or indicator
- # binary operator to specify interactions
- ## binary operator to specify full-factorial interactions
- use ib#., ib(first)., ib(last)., ib(freq). to set base level
- ibn. means no baselevel
- ".fvset base 3 group" sets the base for group to be 3
- ".list if 3.group" to list all when group is equal to 3.
- ".gen over_age=cond(3.group, age-21, 0)"
Tuesday, October 23, 2012
"YOUTH" - Samuel Ullman
Source: Samuel Ullman Museum
Youth is not a time of life; it is a state of mind; it is not a matter of rosy cheeks, red lips and supple knees; it is a matter of the will, a quality of the imagination, a vigor of the emotions; it is the freshness of the deep springs of life.
Youth means a temperamental predominance of courage over timidity of the appetite, for adventure over the love of ease. This often exists in a man of sixty more than a boy of twenty. Nobody grows old merely by a number of years. We grow old by deserting our ideals.
Years may wrinkle the skin, but to give up enthusiasm wrinkles the soul. Worry, fear, self-distrust bows the heart and turns the spirit back to dust.
Whether sixty or sixteen, there is in every human being's heart the lure of wonder, the unfailing child-like appetite of what's next, and the joy of the game of living. In the center of your heart and my heart there is a wireless station; so long as it receives messages of beauty, hope, cheer, courage and power from men and from the infinite, so long are you young.
When the aerials are down, and your spirit is covered with snows of cynicism and the ice of pessimism, then you are grown old, even at twenty, but as long as your aerials are up, to catch the waves of optimism, there is hope you may die young at eighty.
青 春 - 塞缪尔.乌尔曼
人生匆匆,青春不是易逝的一段。青春应是一种永恒的心态。满脸红光,嘴唇红润,腿脚灵活,这些都不是青春的全部。真正的青春啊,它是一种坚强的意志,是一种想象力的高品位,是感情充沛饱满,是生命之泉的清澈常新。
青春意味着勇敢战胜怯懦,青春意味着进取战胜安逸,年月的轮回就一定导致衰老吗?要知道呵,老态龙钟是因为放弃了对真理的追求。
无情岁月的流逝,留下了深深的皱纹,而热忱的丧失,会在深处打下烙印。焦虑、恐惧、自卑,终会使心情沮丧,意志消亡。
60也罢,16也罢,每个人的心田都应保持着不泯的意志,去探索新鲜的事物,去追求人生乐趣。我们的心中都应有座无线电台,只要不断地接受来自人类和上帝的美感、希望、勇气和力量,我们就会永葆青春。
倘若你收起天线,使自己的心灵蒙上玩世不恭的霜雪和悲观厌世的冰凌,即使你年方20,你已垂垂老矣;倘若你已经80高龄,临于辞世,若竖起天线去收听乐观进取的电波,你仍会青春焕发。
Friday, October 19, 2012
Look AHEAD halted: Lifestyle management fails to reduce hard CV outcomes in diabetics
Look AHEAD halted: Lifestyle management fails to reduce hard CV outcomes in diabetics
Source: theHeart.org
Los Angeles, CA - The Action for Health Diabetes (Look AHEAD) study, a trial comparing an intensive lifestyle-intervention program aimed at achieving and maintaining weight loss and fitness in patients with type 2 diabetes, has been stopped for futility.
A large cardiovascular-outcomes study funded by the National Institutes of Health that included 5145 adults with diabetes and a body mass index >25 kg/m2, Look AHEAD failed to show a difference in the rate of nonfatal MI, nonfatal stroke, death, or hospitalization for angina among patients randomized to an intensive lifestyle intervention and those randomized to a control arm consisting of education alone.
Despite significant reductions in weight and improvements in physical-fitness levels among patients with diabetes, investigators concluded that the intervention arm, which included individual sessions with a nutritionist and/or personal trainer, as well as group sessions and refresher courses, failed to provide any benefit in terms of cardiovascular outcomes.
Dr Anne Peters (University of Southern California, Los Angeles), one of the study investigators, said in an interview that the trial was successful on one level-namely, that patients lost weight and improved their fitness. Data published at four years showed that the intensive intervention led to weight loss of up to 10% in the first year and that patients maintained a 6.5% reduction in body weight in the following three years. Over an 11-year follow-up period, the patients reported a 5% reduction in body weight from baseline, said Peters.
In addition, early data showed that treadmill fitness levels, hemoglobin A1c levels, systolic and diastolic blood pressure, HDL-cholesterol levels, and triglyceride levels were all significantly improved among patients in the lifestyle-intervention arm when compared with the control group. The only cardiovascular risk factor that remained unchanged with treatment was LDL-cholesterol levels.
Despite the lack of cardiovascular benefit observed in Look AHEAD, Peters stressed that diabetic patients should not stop exercising or begin eating anything they wish.
"We do know that weight loss and exercise can prevent diabetes," said Peters. "I am a big advocate of prevention, both early prevention of obesity altogether, as well as prevention of diabetes in individuals who have become overweight. Lifestyle changes can help prevent diabetes. Once you have diabetes, I think weight loss and exercise can have benefits, but they are not going to reduce the risk for the primary outcome that we set for Look AHEAD, which was a risk for macrovascular events or death."
Thursday, October 11, 2012
Tips of Using SAS
Tips of Using SAS
- Richard Koopmann, Jr (2012). Building Macros and Tracking Their Use. This paper provides a framework for developing component macros that report back macro usage.
- DM is a statement for submitting SAS program Editor, Log, Procedure Output or text editor commands as SAS statemetns. you can use -DM 'CAPS ON'- to set the upper case, use -DM 'COLOR COMMAND RED'- to set the command in red. Usually, I run the OPTIONS or DM at the beginning of my SAS codes.:
DM 'KEYDEF F12 NEXT'; * ASSIGNS
THE 'NEXT'
COMMAND
TO
THE F12 KEY;
OPTIONS NOFMTERR FORMDLIM='-' FORMCHAR='|----|+|---+' CENTER=0 MPRINT=1 MLOGIC=1;- Learn the basics of PROC TRANSPOSE (2009)
- HASUG Current and Previous Newsletters has some nice handy articles, such as how to use PROC TRANSPOSE (2005), how to use two editors (2005), tips and tricks for create report (2008).
- ...
Tuesday, September 18, 2012
In ‘Obesity Paradox,’ Thinner May Mean Sicker
Source: New York Times
"… Dr. Neil Ruderman, an endocrinologist at Boston University School of Medicine, was the first to identify a condition he called "metabolically obese normal weight," in 1981. Such people have weights in the normal range on the B.M.I. chart but also have metabolic abnormalities, including high levels of insulin resistance and triglycerides; they tend to carry fat around the middle, which is more apt to affect the heart, liver and other organs than fat in the hips and thighs…."
This evidence is not new. I post here to reminder myself about this called 'paradox' (not a paradox to me).
This evidence is not new. I post here to reminder myself about this called 'paradox' (not a paradox to me).
Tuesday, September 11, 2012
Geriatric Obesity - a Special Issue of International Journal of Obesity
International Journal of Obesity just released a special issue on geriatiric obesity. It concluded that more research is needed to clarify the definition, to evaluate the tiem of treatment, and strategies treatment of obesity in older adults.
Scoping review report: obesity in older adults
Scoping review report: obesity in older adults
Obesity in the elderly: an emerging health issue
|
Monday, September 10, 2012
Tips of Using PortableApps
Tips of Using PortableApps
PortableApps.com is the world's most popular portable software solution allowing you to take your favorite software with you. The launcher is not as good as I expect; I am using PStart and manually change some 'ini' files to meet my needs:
PortableApps.com is the world's most popular portable software solution allowing you to take your favorite software with you. The launcher is not as good as I expect; I am using PStart and manually change some 'ini' files to meet my needs:
- How to disable the splash screen of AppNamePortable:
- go to "\PortableApps\AppNamePortable\Other\Source".
- open "AppNamePortable.ini".
- change " DisableSplashScreen=False" into " DisableSplashScreen=True ", and save change.
- copy "AppNamePortable.ini" into "PortableApps\AppNamePortable".
- How to remove PortableApps icon from task bar (to minimize to tray).
- go to "\PortableApps\PortableApps.com\Data\".
- open "PortableAppsMenu.ini".
- under [DisplayOptions], add "Windows7TaskbarIcon=false".
- How to set global hot key (11.1 and up)
- by default, the platform uses a global hot key of Ctrl-Alt-Space to show the menu from other apps.
- open "\PortableApps\PortableApps.com\Data\PortableAppsMenu.ini"
- changing the line GlobalHotKey=CTRL-ALT-SPACE to another value. Valid entries are CTRL-ALT-SPACE, CTRL-ALT-P, CTRL-ALT-M, CTRL-SPACE, WIN-ALT-SPACE and DISABLED.
- How to set autorun modification detection
- open "\PortableApps\PortableApps.com\Data\PortableAppsMenu.ini"
- changing the line AutoRun=true to AutoRun=false in the [Protection] section. Note that some antivirus products may show an alert when an autorun.inf is read.
- Q & A of PortableApps.com Platform and Suite Support
- ...
Friday, September 07, 2012
How to Combine the Results after the Multiply Imputation
How to Combine the Results after the Multiple Imputation
The overall estimate of Q is simply the average of the M estimates from M multiple imputed datasets.

The overall variance of  is
is
 is
is
Where the average variance of M within-imputed datasets ( ) is
) is  and the variance between-imputed dataset is
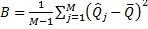
The overall degree of freedom (df) is
 ) is
) is  and the variance between-imputed dataset is
The overall degree of freedom (df) is

Where the df of imputed datasets is 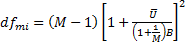 and the df of observed data is
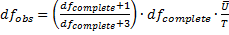
If the df of the complete data (dfcompleted) are large [Notes: for complex sampling design, dfcomplete = # of PSU - # of Strata], the overall degree of freedom is
 and the df of observed data is
If the df of the complete data (dfcompleted) are large [Notes: for complex sampling design, dfcomplete = # of PSU - # of Strata], the overall degree of freedom is

Then, the confidence intervals can be

The estimated percent rate of missing information for Q is

Notes: Usually M = 5 or 10 is enough, but the M is better to be great than the percent rate of missing information.
Wednesday, August 29, 2012
How to Overlining Words in Microsoft Word
Tips: Windows
- How to access Windows Startup folder: Win + R; run "shell:startup" to open user's startup folder; run "shell:common startup" to open all users' startup folder
- How to pop-up emoji window: WIN + ; or WIN + .
- How to type mathematical symbol
- Pop-up Character Map windows: WIN + s ==> type "character map" and run the app.
- AutoHotKey command: send {U+xxxx}
- AutoHotKey script: UnicodeInput.ahk
- The UnicodeInput Utility
- Insert an ASCII or Unicode character into a document
- MS Word Tricks: Typing Math Symbols
- How to Overlining Words in Microsoft Word
- Highlight words to be overlined.
- Press <Ctrl+F9> to insert field braces, {}.
- Type EQ \x \to(hgihlighted words).
- Delete the extra spaces after and before the field braces.
- Press <F9> to show the results.
- Press Shift+F9 to show the field code again.
- Using { Fields } in Microsoft Word
- How to Insert Fields in Your Word 2010 Document
- Word 2010 Shortcuts
Tuesday, August 28, 2012
Fifty Shades of Brown
Fifty Shades of Brown: The Evolving View of Fat
Source: Circulation
This is an editorial article of a PVAT (Perivascular adipose tissue) study supports fat is friend not foe. I have learned decades ago in my medical school that the BAT (brown adipose tissue) which is major thermogenetic fat for an infant, especially cold area of world without heat. Now, researchers find that adults also have the BAT a little bit here and a little bit there.
"...
The relationship between increased body mass index and risk for diabetes mellitus or cardiovascular disease is well established. Such observations have driven considerable interest into the nature of adipose tissue and what mechanisms might help explain how adipose tissue and specific aspects of adipocyte biology influence cardiometabolic disorders. For example, adipocytes are now recognized as a source of mediators released into the circulation, like the adipokines resistin and adiponectin, which can modulate inflammation, insulin sensitivity, and atherosclerosis. Other molecules released from adipocytes like free fatty acids and reactive oxygen species can also exert both local and distant effects that may be integral to the development of diabetes mellitus, atherosclerosis, and their complications. To an increasing extent, adipose tissue is now understood as an organ playing important physiological and pathological roles. Both the absence of fat, as with certain lipodystrophies, and excess adiposity are associated with diabetes mellitus, with mechanisms that appear to include infiltration of inflammatory cells into adipose tissue and the release of systemic mediators.
..."
Tuesday, August 14, 2012
U.S. News Best Hospitals 2012-13: the Honor Roll - US News and World Report
U.S. News Best Hospitals 2012-13: the Honor Roll - US News and World Report
Source: USNews.com
A guide to U.S. hospitals, featuring extensive rankings, ....
Source: USNews.com
A guide to U.S. hospitals, featuring extensive rankings, ....
Wednesday, August 08, 2012
How to calculate confidence interval of incidence rate under the Poisson distribution
How to calculate the confidence interval of incidence rate under the Poisson distribution
Incidence rate (IR) = # event (N) / person-time at risk (T)

(1- α) % CI of IR = 

If N is large, 95% CI of N = 

95% CI of IR =  =
= 
 =
= 
You may use PQRS or use an online calculate like GraphPad QuickCalcs, or Quantile Function Calculator to get a quantile of the chi-square distribution.
The Online OpenEpi, a nice Epidemiologic Calculator, provides different ways to get these confidence intervals. I noticed, if N = 0, the calculator gives N = 0.5 to avoid unrealistic results.
Stata can give exact Poisson CI:
.cii T N, poisson

Subscribe to:
Posts (Atom)